Should commodities be part of one’s portfolio? – Part III

Investors can improve the stability and return of their portfolio by owning a highly diversified set of assets thru proper asset allocation. During these past couple of weeks, we have shown that a commodities allocation can be an excellent portfolio diversifier because their return characteristics are different to stocks and bonds. Commodities provide a combination of diversification plus inflation protection.
After discussing metals and energy commodities in prior articles (see Should commodities be part of one’s portfolio? Part 1 & 2, Oct. 3 & 10, 2016), today we will be focusing on the less familiar agricultural commodities. Agricultural commodities are further subdivided into softs, grains and meats.
Unpredictable nature
While precious metals, especially gold, have been a firm feature of an asset allocator’s portfolio, agricultural commodities are often left out. This is because agricultural commodities are considered more volatile and less predictive in nature. The main drivers of agricultural returns are weather-related supply disruptions, water shortages, climate change and trends in bio-fuel production.
For some investors, however, it is this low correlation and counter-cyclical element that makes agricultural commodities attractive when held as part of a broadly-based diversified portfolio.
Soft commodities are surging
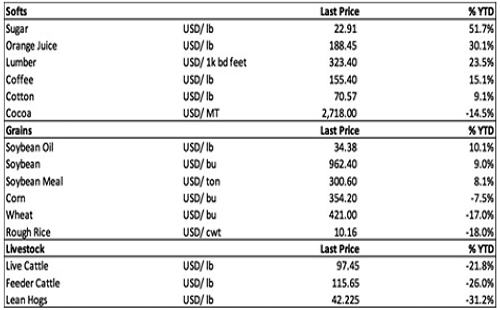
The soft commodities markets are made up of coffee, cocoa, cotton, orange juice and sugar. While gold and oil have hogged the limelight this year, the best performing commodities are actually the softs like sugar, orange juice and lumber.
Sugar prices are up 51.7 percent so far this year or triple gold’s 17. 9 percent gain and oil’s 16.2 percent return. Orange juice and lumber are up 30.1 percent and 23.5 percent year-to-date, respectively.
Source: Bloomberg, Wealth Securities Research
The performance of grains is mixed with the soybean complex positive this year while corn, wheat and rough rice are down year-to-date.
Meanwhile, livestock prices hover near their lowest levels in years as US meatpackers produced the largest volume of meat in history. Prices of livestock are down an average of -26 percent year-to-date.
Simulating a diversified portfolio of stocks/bonds/commodities
We end this article by showing you that adding a commodity component helps improve the overall stability and return-to-risk performance of a portfolio under most market conditions.
As an example, we will simulate a portfolio made up of 30% stocks, 30% long-term treasury, 25% intermediate-term bonds, 7.5% gold and 7.5% commodity basket. These will be represented by the following liquid ETFs:
30% SPDR S&P 500 Index (SPY)
30% iShares Barclays Long-Term Treasury 15-18yr (TLT)
25% iShares Core Total US Bond 4-5yr (AGG)
7.5% SPDR Gold Shares (GLD)
7.5% PowerShares DB Commodity Index (DBC)
Using the ETF backtesting software ETFReplay, we then compare its 10-year performance to a benchmark 60-40 stock/bond portfolio and to the S&P 500 index.
Here are the results:
10 year performance (Oct. 15, 2007 – Oct. 14, 2016)
Source: ETFReplay.com, Wealth Securities Research
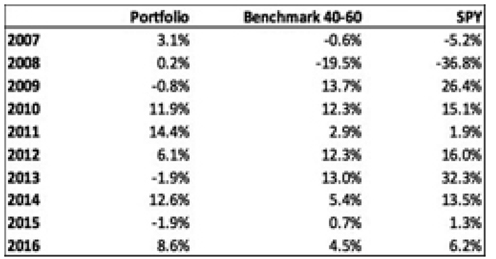
Annual performance
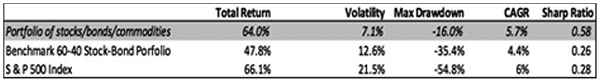
Against the benchmark 60-40 stock/bond portfolio, our sample diversified portfolio of stocks/ bonds/commodities outperformed with a total return of 64 percent vs. 47.8 percent over the past 10 years. Volatility is also much lower and max drawdown of 16 percent is just half of the benchmark 60-40 portfolio’s 35.4 percent.
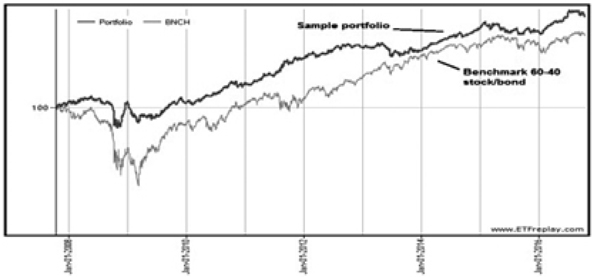
Sample portfolio vs. benchmark 60-40 (10 years)
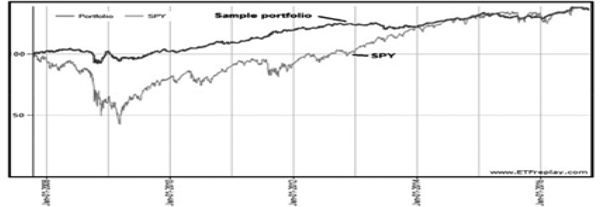
Compared to the S&P 500 (as represented by SPY), our sample portfolio’s 64 percent total return is very close to the S&P 500’s 66 percent return over 10 years. But more importantly, the volatility of returns is only a third of the S&P 500’s volatility. In addition, the max drawdown of 16 percent is significantly lower than the S&P 500’s 54.8 percent drawdown during the Global Financial Crisis of 2008-09.
Also note that the worst annual return for the diversified portfolio of stocks/bonds/commodities is only -2 percent vs. the -36.8 percent for the S&P 500.
Sample Portfolio vs. SPY (10 years)
Asset allocation – the most powerful determinant
It is common thinking that commodities are more volatile than stocks or bonds. Surprisingly, the tables and charts above show that over a ten-year period a diversified portfolio that includes commodities, bonds and equities can have an equally positive return with less volatility and drawdowns.
In conclusion, asset allocation is a powerful tool, and is by far the most important determinant of risks and returns that a portfolio will generate over time.
Philequity Management is the fund manager of the leading mutual funds in the Philippines. Visit www.philequity.net to learn more about Philequity’s managed funds or to view previous articles.


- Latest
- Trending